
Evaluate accuracy, repeatability, cost, and handoffs with a small but representative product imagery trial.
The starting point
A compelling demo shows what a workflow can produce under selected conditions. Your evaluation needs to show what it can produce with your garments, references, deadlines, and reviewers. The difference is the basis of a useful purchasing decision. Judge the work you can approve, not just the previews you enjoy looking at.
Begin with a written acceptance standard and a representative test set. Include straightforward items and products that expose likely weaknesses: repeated prints, reflective materials, unusual closures, or layered construction. Keep the test manageable enough that a reviewer can inspect every result carefully.
Make accuracy the first gate
Identify the details that define each garment. Count fasteners, record pocket placement, and note distinctive trims or shapes. Compare candidate images with verified references. If the product changes, record a failure even when the image looks polished. Aesthetic preference can be scored after the garment passes this basic review.
Use clear categories such as approved, approved for limited use, correction required, and rejected. Explain the reason for each decision. A campaign concept may be useful without being suitable for a product listing; the evaluation should preserve that distinction instead of forcing every result into one success rate.

Measure the complete route to approval
Track source preparation, production attempts, human correction, review, and export. Record the people involved and the time they spend. Add the relevant software or production charges. Divide the total by the number of approved assets for the intended use, while keeping one-time setup work visible.
In a hypothetical trial, a low-cost workflow produces many previews but requires substantial manual repair. A second produces fewer candidates and more approved images. The first may still be useful for concepts, but the second may be more economical for the specific catalog job. The decision should follow the measured workflow rather than the advertised generation price.
Test whether another person can repeat it
Ask a teammate who did not run the first trial to follow the saved brief and references. Observe where they need clarification or make different decisions. A workflow that depends on undocumented tricks may create a bottleneck even when its best results are excellent.
Check the handoff into your actual asset library and website process. Can files be matched to products? Can approved versions be distinguished from drafts? Can a reviewer find the source reference later? These operational questions affect the usefulness of the images after generation ends.

Make the decision with explicit limits
- List the product types and image roles that passed the trial.
- Record failures that require another workflow or real photography.
- Confirm applicable usage terms and data handling with the responsible owners.
- Document the cost calculation and its assumptions.
- Set a review point before expanding to a substantially different collection.
Avoid translating a small trial into a promise of permanent savings or universal quality. Changes in garment complexity, staffing, or requirements can alter the result. Keep the evaluation specific enough that somebody can tell when it still applies.
A useful scorecard supports a practical decision: adopt this workflow for these tasks, with these checks. That is a stronger conclusion than declaring one tool the best at everything, and it gives the team a clear path for reviewing the decision as its needs change.
Market context, with limits
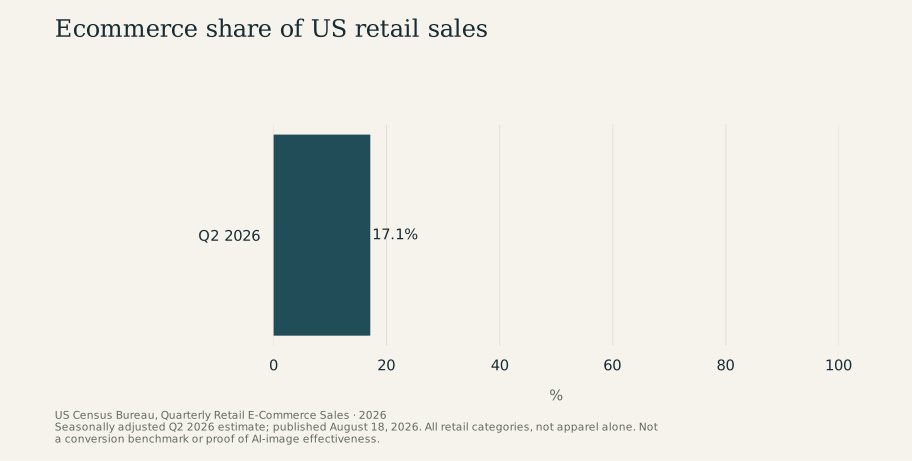
The US Census Bureau estimated seasonally adjusted retail ecommerce sales of $340.2 billion in Q2 2026, or 17.1% of total retail sales. These figures cover all retail ecommerce, not apparel alone, and do not demonstrate a benefit from any image tool. Source: US Census Bureau, August 18, 2026 release.
Research & sources
These findings describe the named studies and companies. They provide context, rather than measuring Atellia or establishing the effect of the advice above. Source dates are separate from retrospective theme years.
Ecommerce share of US retail sales
2026 · %
View chart data
| Measure | % |
|---|---|
| Q2 2026 | 17.1 |
Study scope and numerical references
- US retail ecommerce sales, second quarter: 340.2 USD billion. Q2 2026; seasonally adjusted, not price adjusted; all US retail ecommerce, not apparel alone. US Census Bureau, Quarterly Retail E-Commerce Sales, August 18, 2026, 2026
- Ecommerce share of total US retail sales: 17.1 %. Q2 2026 seasonally adjusted estimate. Not an Atellia result or evidence of image-driven uplift. US Census Bureau, Quarterly Retail E-Commerce Sales, August 18, 2026, 2026