A practical experiment brief for comparing product imagery while separating creative preference from measurable customer behaviour.
The starting point
A new image can look stronger and still leave you unsure whether it improved a product page. Sales change with availability, traffic sources, promotions, seasonality, and many other factors. If several of those change alongside the image, the photograph may receive credit for an outcome it did not cause.
Begin with a question narrow enough to test. For example: does a clearer full-length image help shoppers engage with a dress listing compared with the current lead image? This is more useful than asking whether AI images outperform photography in general. A test compares particular assets in a particular setting.
Write a one-page experiment brief
Describe the control, the proposed variation, the audience, and the primary outcome. Add a guardrail that would reveal a harmful trade-off. If the main measure is purchase conversion, you may also want to watch product-related complaints or returns over an appropriate period. The relevant measures depend on the question and the data available.
Set the decision rule before seeing the results. Discuss how much traffic is needed to distinguish a meaningful difference from noise, using someone with experimentation expertise when the decision warrants it. An arbitrary short deadline does not create reliable evidence. Low-traffic stores may need a narrower question or qualitative research first.
Keep the comparison interpretable
Change one important aspect at a time where practical. If the new page has a different image, price, description, and promotion, the result applies to that bundle. It cannot tell you which element helped. Sometimes testing a bundle is appropriate, but label the conclusion accordingly.
Use a valid randomised comparison when your tools and traffic support it. A before-and-after comparison is more vulnerable to external changes. If that is the only available approach, record what else happened during the period and describe the result as directional evidence rather than proof.
Inspect the experience before measuring it
Check that both variants load correctly and show the intended crop on relevant devices. Confirm that tracking records the event you think it records. A broken image, missing button, or inconsistent page speed can overwhelm the creative question and turn the test into a technical comparison.
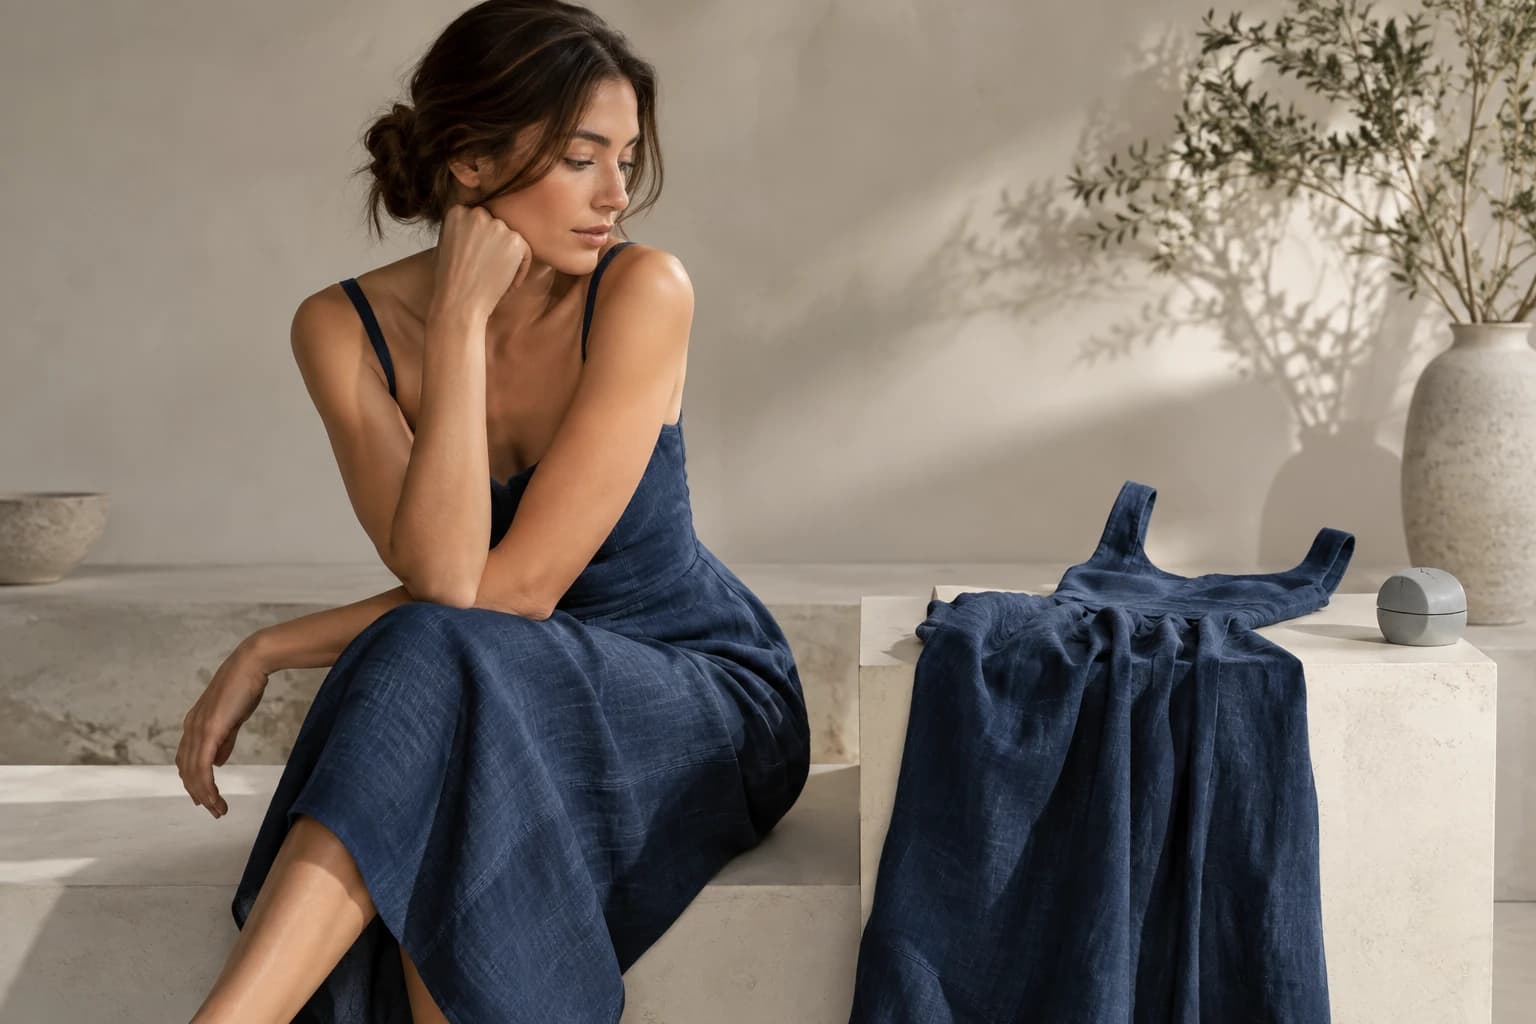
Ask a few customers or colleagues unfamiliar with the change what they understand from each image. This can reveal a simple issue before a larger test: perhaps the new pose hides the product's length, or the background makes the colour hard to judge. Qualitative feedback explains possible mechanisms; it does not replace measured results.
Read the result with its limits intact
Report the observed difference, the uncertainty, the time period, and the scope. Avoid translating a result on one product into a promise for the entire catalogue. A patterned dress and a plain sweatshirt may need different imagery. Repeat or expand the test when the next decision requires broader evidence.
If the result is inconclusive, keep that label. It may mean the change has little effect, the sample is too small, or the test was not sensitive to the question. Do not search through many secondary metrics until one produces a flattering story.
Save the tested assets with the brief and the result. Over time, a library of clearly framed experiments becomes a more useful creative resource than a collection of unsupported uplift claims. It tells the next team what was learned, where it applies, and what still needs to be tested.
Research & sources
These findings describe the named studies and companies. They provide context, rather than measuring Atellia or establishing the effect of the advice above. Source dates are separate from retrospective theme years.
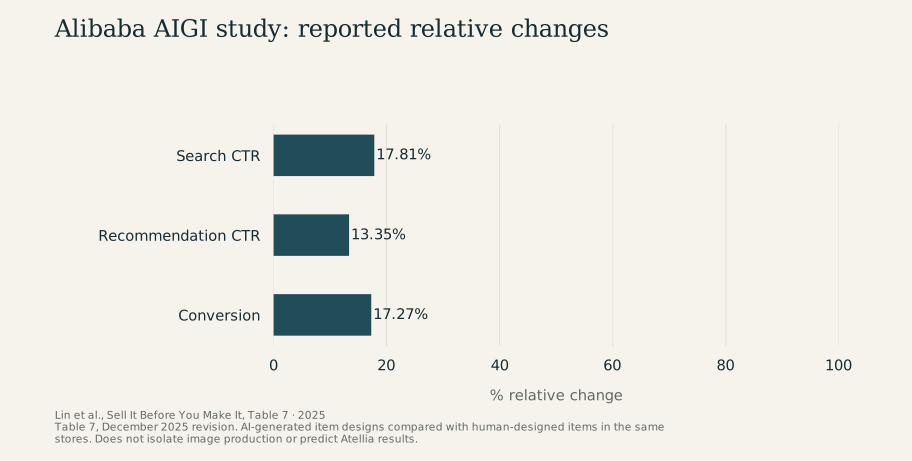
Alibaba AIGI study: reported relative changes
2025 · % relative change
View chart data
| Measure | % relative change |
|---|---|
| Search CTR | 17.81 |
| Recommendation CTR | 13.35 |
| Conversion | 17.27 |
Study scope and numerical references
- Search click-through relative lift: 17.81 %. Same-store item comparison, averaged by store; AI-designed items versus human-designed items. Lin et al., Sell It Before You Make It, Table 7, 2025
- Recommendation click-through relative lift: 13.35 %. Same-store item comparison, averaged by store; not an isolated photography test. Lin et al., Sell It Before You Make It, Table 7, 2025
- Conversion relative lift: 17.27 %. Same-store AI-designed versus human-designed item comparison. Lin et al., Sell It Before You Make It, Table 7, 2025