
Calculate production cost with review time, rejected outputs, retouching, and delivery included rather than comparing subscription prices alone.
The starting point
An image budget is useful only if it describes the images your business can actually use. A subscription price, a day rate, and a per-generation charge measure different pieces of work. Comparing them directly can make a cheap workflow look expensive or an expensive workflow look deceptively cheap.
Start with the delivery requirement. Count the products, the views required for each product, and the extra assets needed for campaigns or launches. Separate essential catalogue views from optional experiments. This gives you a stable denominator before you begin comparing production methods.
Put every step on the worksheet
Include source capture, garment preparation, production, review, correction, export, and upload. Some costs are paid to a supplier; others are staff time. Record both. A workflow that reduces the production bill but adds repeated manual checking may still be useful, but the trade-off should be visible.
Use a consistent rule for allocating shared costs. If a studio day produces both catalogue and campaign work, divide the cost using a stated method rather than assigning all of it to one channel. The exact allocation can be imperfect; consistency makes it easier to compare one drop with the next.

Calculate cost per approved destination-ready asset
Divide the total relevant production cost by the number of approved assets delivered in the required format. Do not count discarded generations or multiple downloads of the same picture as additional finished work. Keep a separate count of attempts so you can see where the process spends effort.
Here is a hypothetical calculation, not an Atellia price or customer result. A batch costs $180 in tool charges, $120 in preparation, and $200 in review and corrections. If it delivers 100 approved assets, the full batch cost is $500 and the cost per approved asset is $5. If only 50 pass, that figure becomes $10.
Add the cost of waiting
A launch delay does not always have a neat dollar value, but it deserves a place in the decision. Record how long the batch takes from usable references to approved delivery. Distinguish active work from waiting for samples, responses, or retries. A shorter production step will not help if approvals remain the main bottleneck.

Consider capacity as well as average cost. Your team may handle a small weekly batch comfortably but struggle during a seasonal launch. Ask how each production option behaves at the busiest point. Extra review staff, rush charges, and delayed corrections can change the economics of that peak.
Run a sensitivity check
Change the assumptions that are most uncertain. What happens if acceptance falls, if every patterned garment needs retouching, or if the required resolution changes? You do not need a complicated financial model. A few alternative rows can show which workflow is robust and which depends on everything going perfectly.
Compare equivalent deliverables. A campaign hero with extensive art direction is not interchangeable with a basic product crop. Likewise, a technically large file is not necessarily useful at the intended display size. Define acceptance criteria before asking a supplier or tool to meet a target price.
After delivery, replace estimates with actual numbers and write a short explanation of the largest differences. Perhaps source preparation took longer, or fewer revisions were needed. Keep those learnings with the next collection brief. Over time, this produces a budget grounded in your garments and your team rather than a headline saving borrowed from someone else's business.
Research & sources
These findings describe the named studies and companies. They provide context, rather than measuring Atellia or establishing the effect of the advice above. Source dates are separate from retrospective theme years.
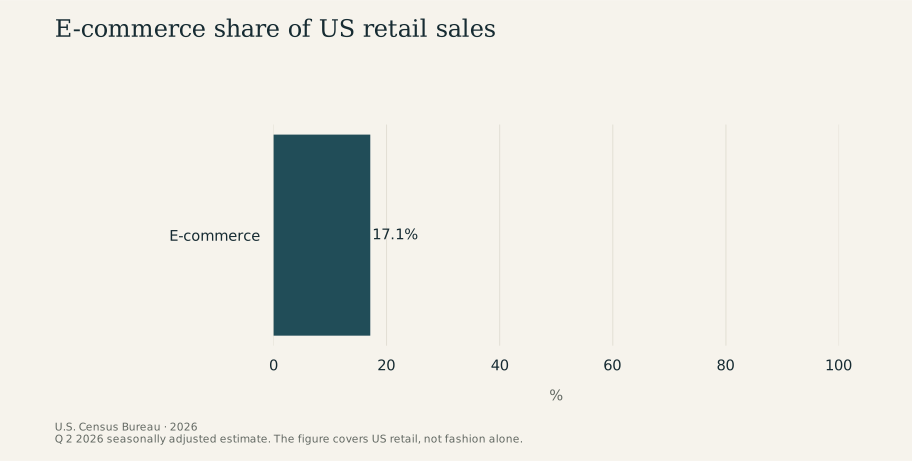
E-commerce share of US retail sales
2026 · %
View chart data
| Measure | % |
|---|---|
| E-commerce | 17.1 |
Study scope and numerical references
- US retail e-commerce sales, second quarter: 340.2 USD billion. Q 2 2026, seasonally adjusted; not price-adjusted. U.S. Census Bureau, 2026
- E-commerce share of US retail sales: 17.1 %. Q 2 2026, seasonally adjusted. U.S. Census Bureau, 2026
- Projected retail returns: 849.9 USD billion. US retail, 2025 projection. NRF and Happy Returns, 2025