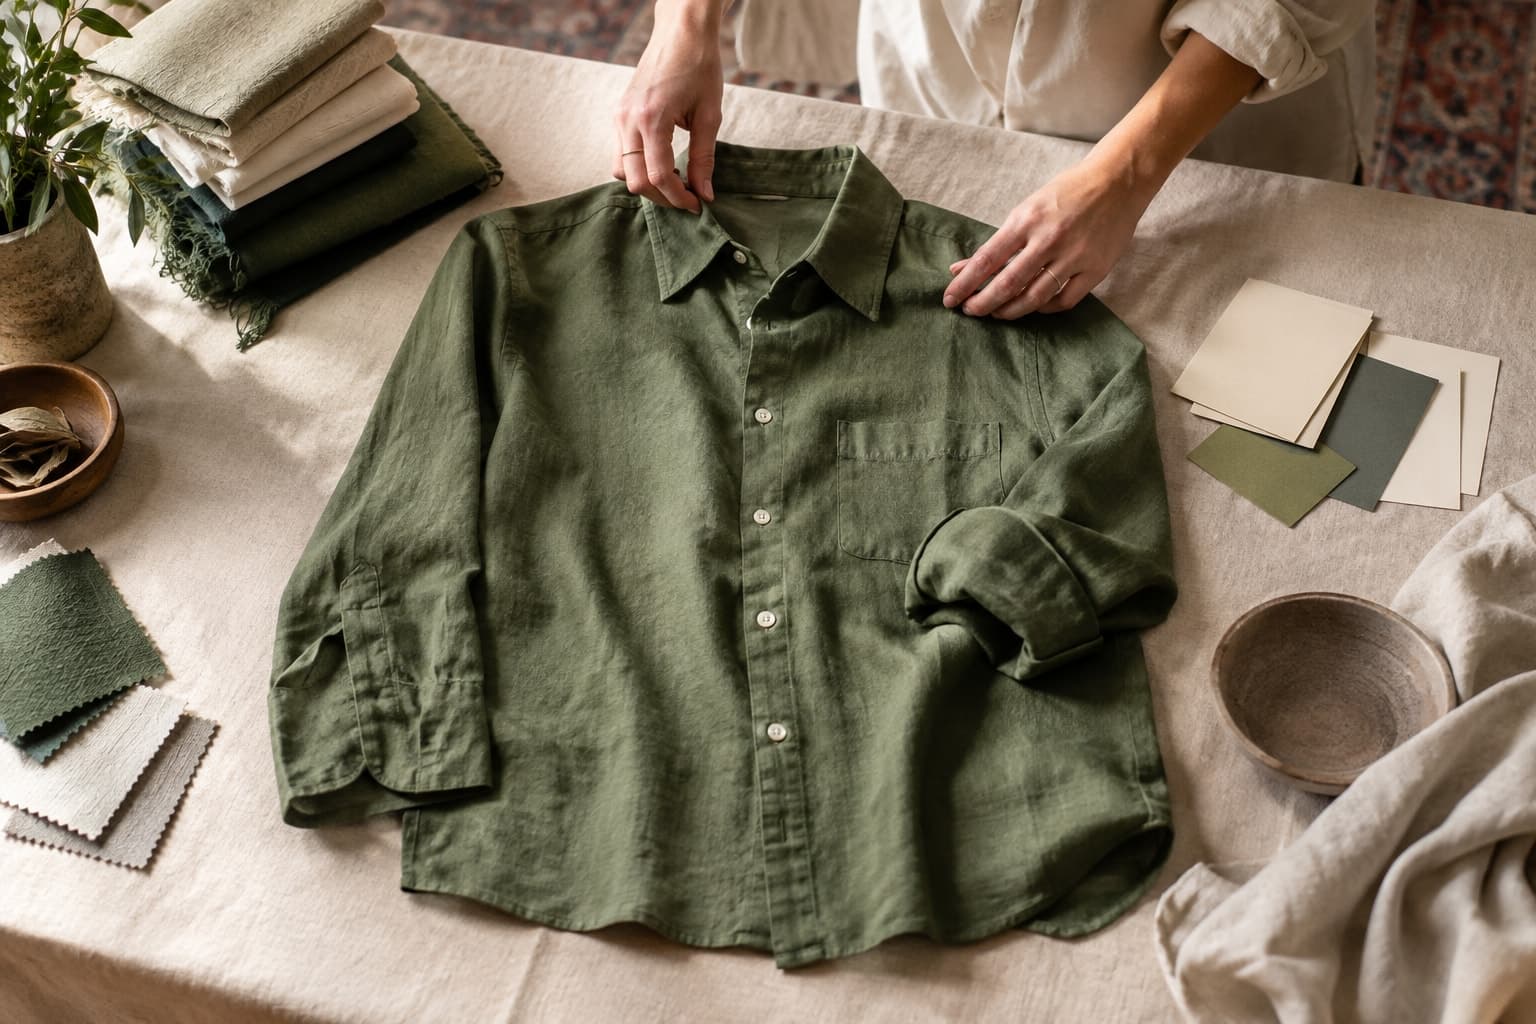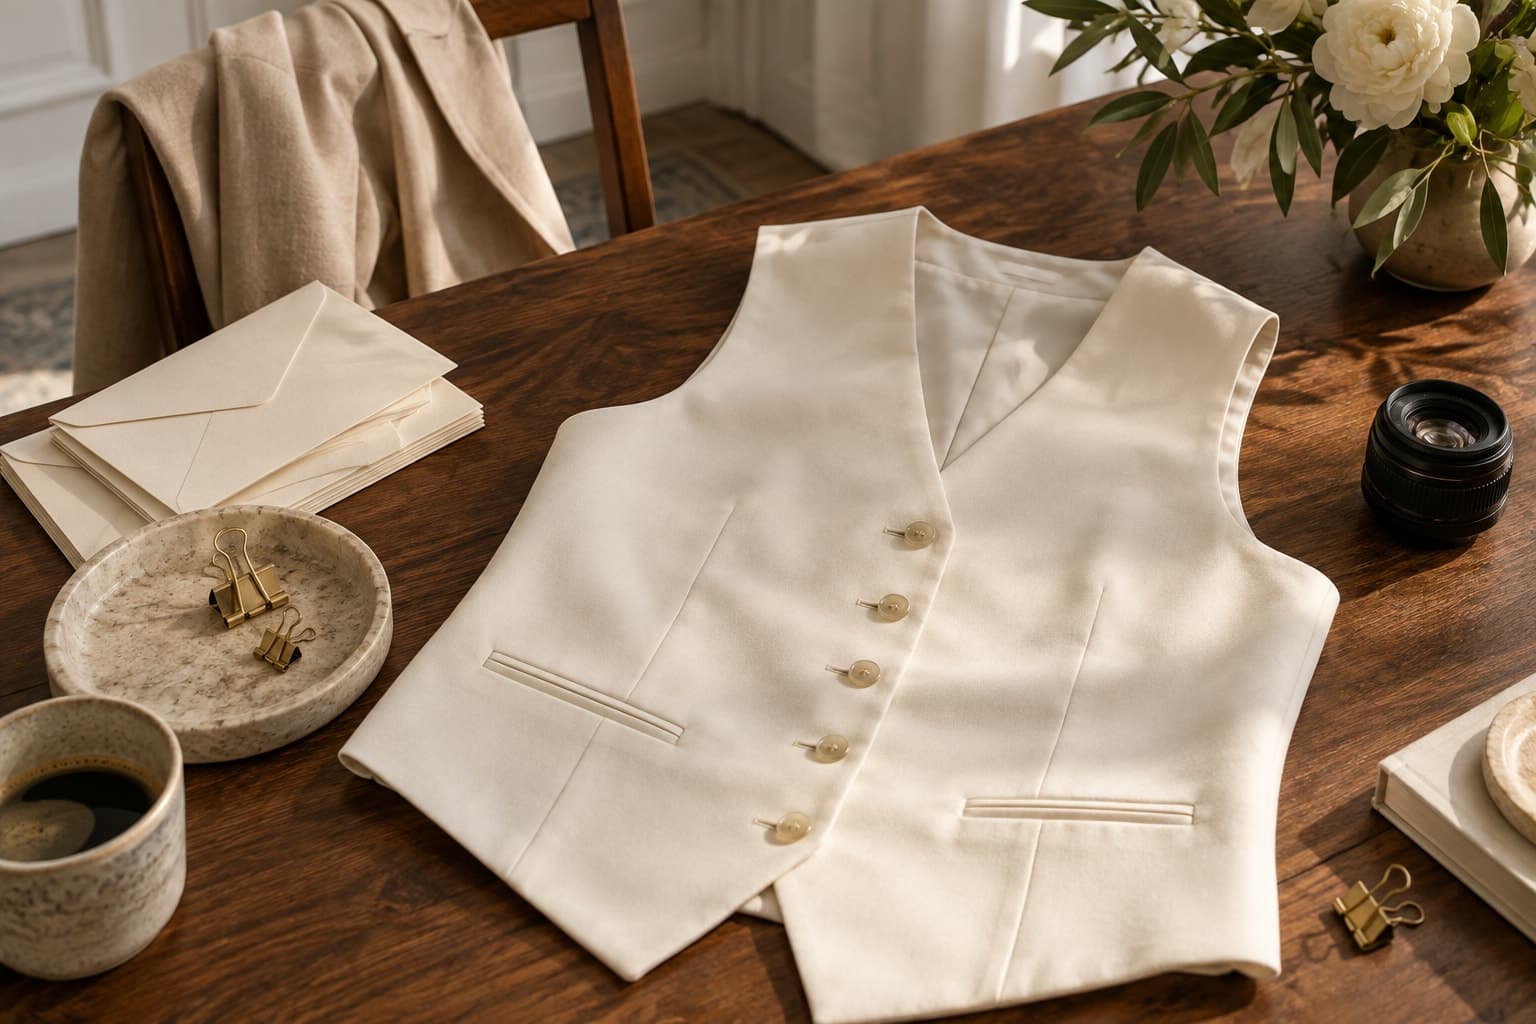
Organise images, sizing, materials, and purchase details around the questions a customer needs answered.
The starting point
A product page meets a shopper at an uncertain moment. They may like the garment but still be unsure about length, texture, fit, or how it compares with something they own. A useful page answers those questions in a sensible order rather than treating every element as an opportunity to persuade.
Begin with the physical product beside the page. Ask what someone could learn by picking it up in a shop: the feel of the fabric, the position of a fastening, the weight of a layer, or the shape of the back. Decide which of those qualities can be shown and which need a written explanation.
What am I looking at?
The first image should make the item easy to identify. Choose a crop that preserves its defining shape, and make the selected colour clear. If the image includes several products, the page title and supporting information should remove ambiguity about what is being sold.
Follow with complementary views rather than near-duplicates. A back view, a close detail, and a useful styling image may answer more questions than several slight variations of the same pose. Review the sequence on a phone, where the shopper may see only one image at a time.
What would I need to know before choosing a size?
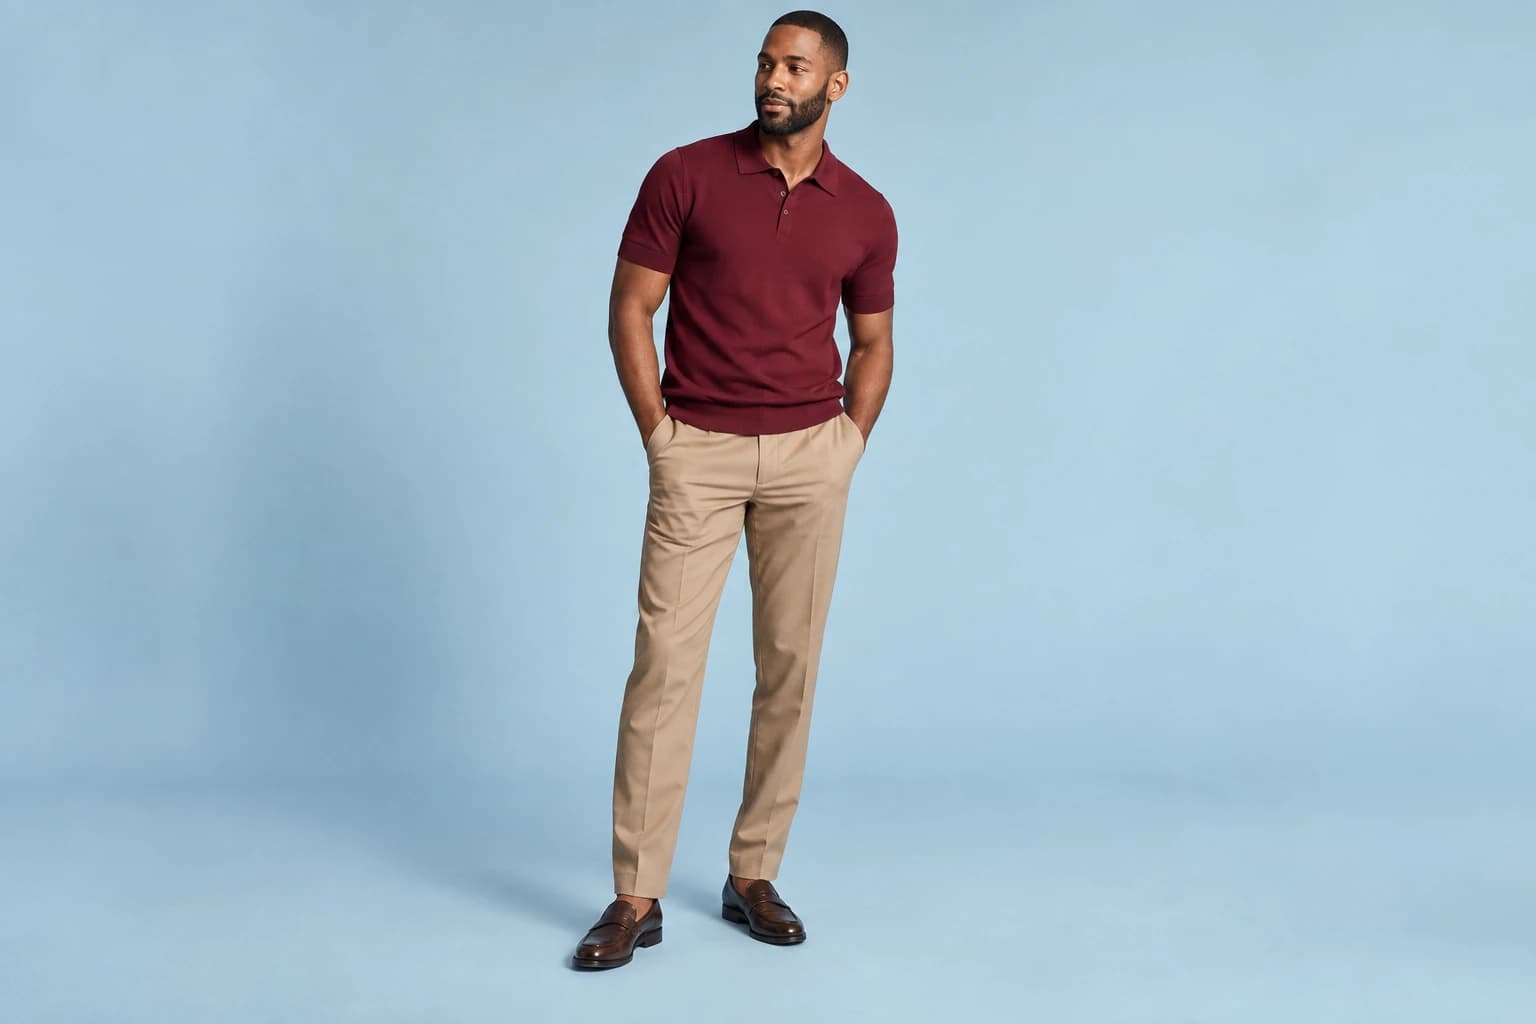
Provide measurements and fit information that are specific to the garment. Explain how measurements were taken and avoid relying entirely on generic size labels. If a model's measurements or worn size are shown, make sure they describe a real, verified reference rather than an invented synthetic subject.
Use images to support this information without asking them to prove precise fit. A full-length view can make proportions easier to understand, while a size chart provides a different kind of evidence. Keep both accessible near the point where the customer selects a size.
What is it made of, and what care does it need?
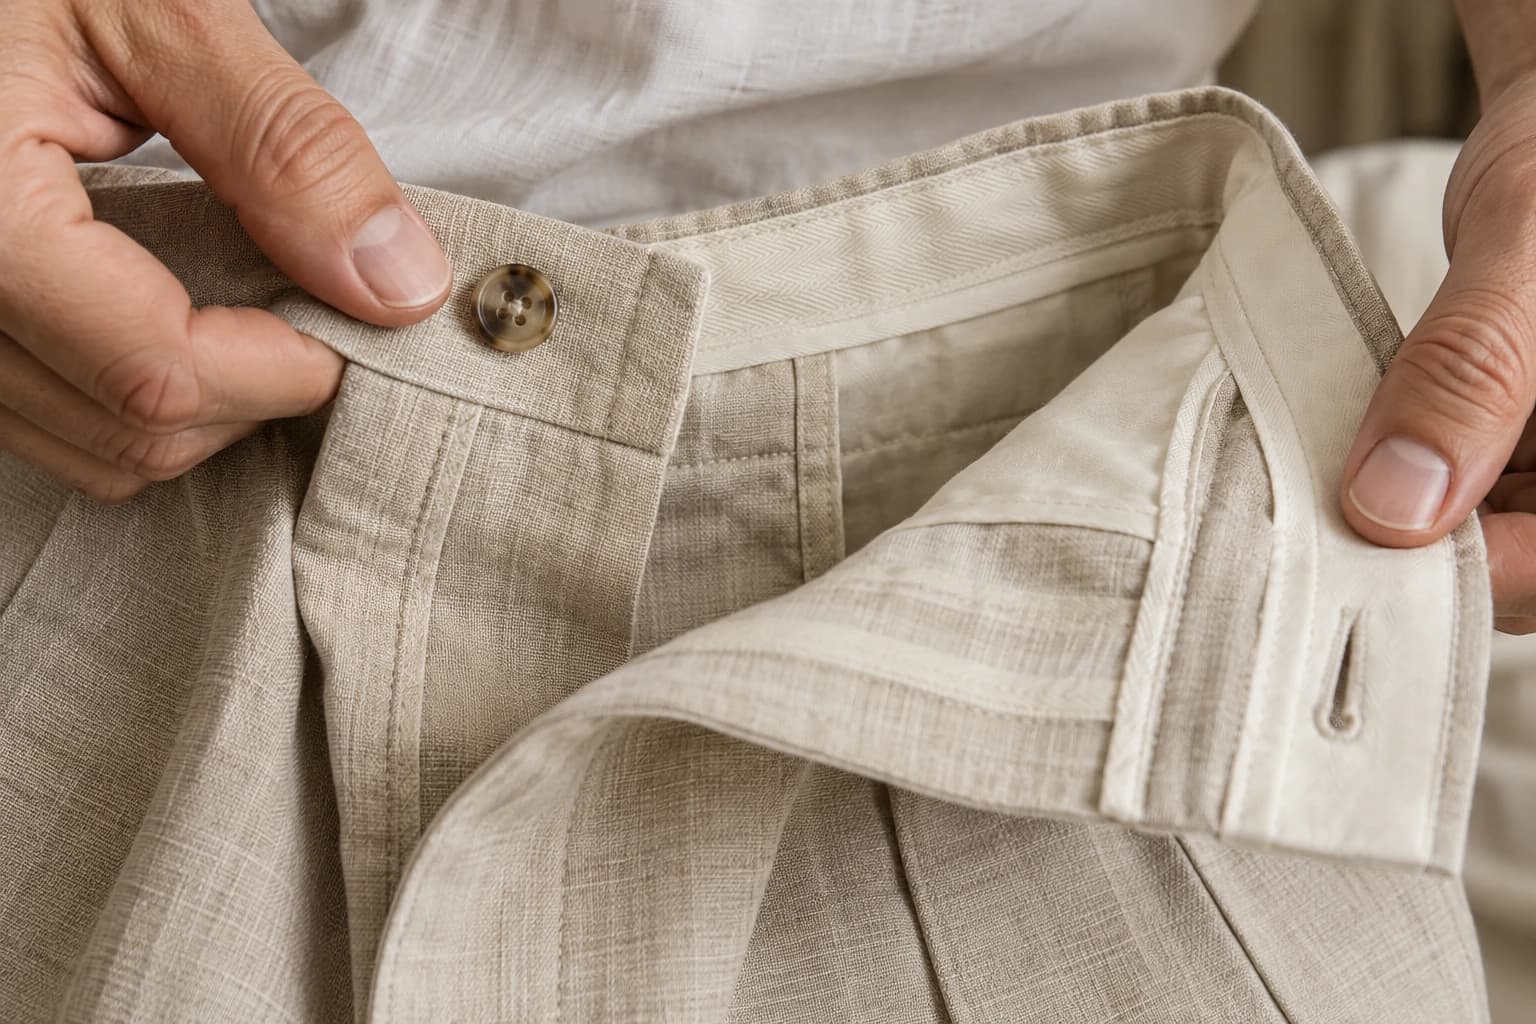
Use approved product data for composition, construction, and care. Translate unfamiliar terms where doing so helps the shopper, but do not replace a precise fact with a vague sensory promise. If the garment is lined, adjustable, or includes removable parts, explain those details plainly.
A detail image can support the text when it shows the relevant feature accurately. Check that texture, hardware, and stitching in generated imagery match the real reference. If they do not, use a direct photograph. The page benefits from a dependable answer more than a visually uniform but uncertain gallery.
What happens after I choose it?
Make availability, delivery information, and the route to return or exchange information easy to find. Keep this material consistent with the store's current policies. The customer should not need to begin checkout just to discover an important condition that could change their decision.
Test the page as an experience: select variants, open the size guide, move through images, and use the page with a keyboard as well as a pointer. Check that important information is not trapped in tiny text or an inaccessible interaction. A polished visual design still needs to function.
Use genuine customer questions to improve the page over time. When support repeatedly explains the same hem length or lining detail, consider whether the page should answer it earlier. The strongest product page grows from the actual uncertainties around the garment, one clear answer at a time.
Research & sources
These findings describe the named studies and companies. They provide context, rather than measuring Atellia or establishing the effect of the advice above. Source dates are separate from retrospective theme years.
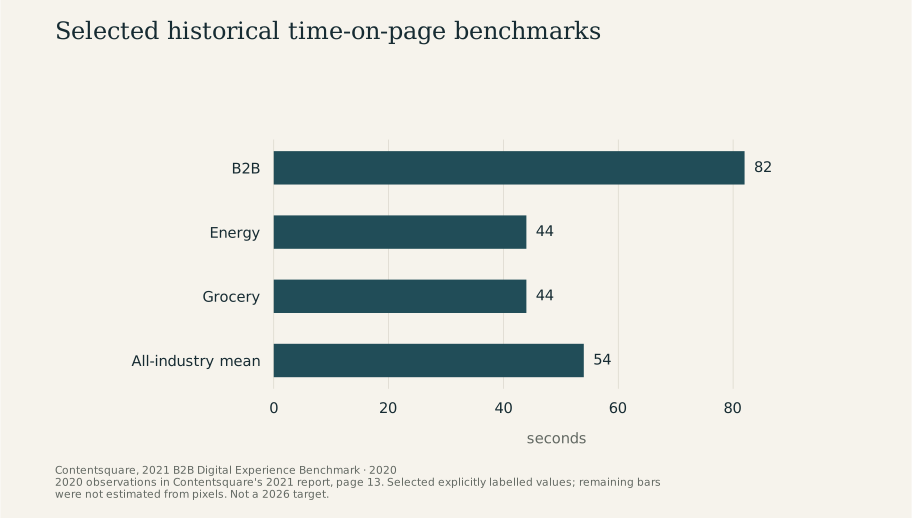
Selected historical time-on-page benchmarks
2020 · seconds
View chart data
| Measure | seconds |
|---|---|
| B2B | 82 |
| Energy | 44 |
| Grocery | 44 |
| All-industry mean | 54 |
Study scope and numerical references
- Average time per page, B2B: 82 seconds. 2020 observations; report published 2021, selected benchmark. Contentsquare, 2021 B2B Digital Experience Benchmark, 2020
- Average time per page, energy and grocery: 44 seconds. 2020 observations; each sector's labelled value. Contentsquare, 2021 B2B Digital Experience Benchmark, 2020
- Average time per page, all industries: 54 seconds. 2020 observations; report methodology:900+global websites and 20+billion sessions. Contentsquare, 2021 B2B Digital Experience Benchmark, 2020